
Bit of a shite of a day/weekend but I did do something...
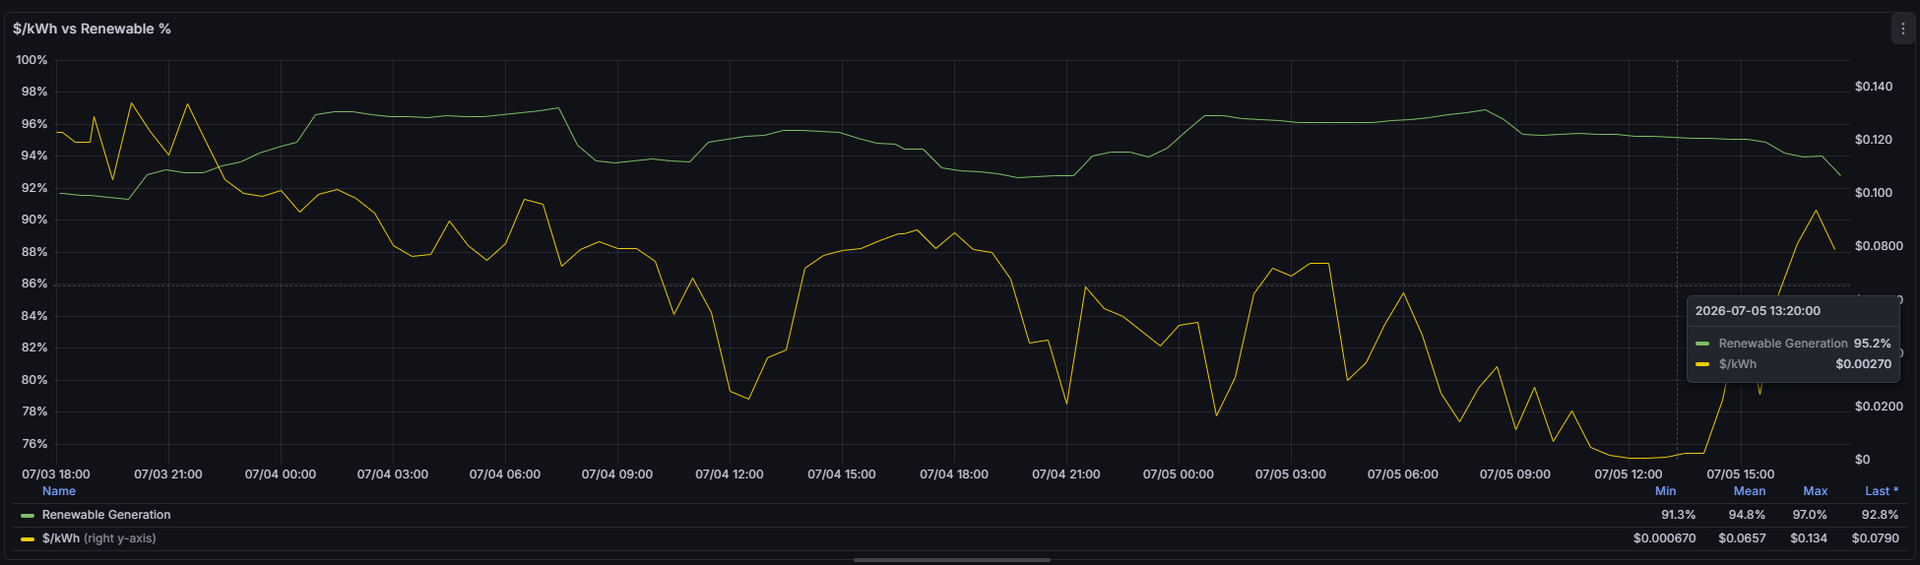
I've taken the Generation Renewable % and plotted it against $/kWh over time. It's not enough data yet but it updates from WITS and em6 every 30 minutes so over time I might be able to build a picture (or a graph I guess) of if there is a direct relationship between the two.
It's not the best graph, I'm a bit fried but it's at least a start.
ALT